coin.click zeigt dir alle Cryptocurrency Coins & Token auf einem Blick.
Finde schnell Bitcoin & High Market Cap Kryptowährungen oder die Newcomeroder Coins, Token und NFT sortiert nach täglichem Volumen,
Und hast du von Coins noch nicht genug,
so studiere technisch den Chart.
und brauchst du Meinungen, so zöger nicht lang,
check die Analysen der Coins.
und halt dich von FOMO und Shit Coins fern. @battle.24find
TOTAL2 Moving Averages · This Bull Market Will Change Your Life
TOTAL2 Moving Averages · This Bull Market Will Change Your Life

March 2024 signaled the end of a bullish cycle. After this month, the Cryptocurrency market went bearish. TOTAL2 index went bearish. As it was bullish, it traded above all the moving averages plotted on this chart. As it went bearish, all the moving averages broke as support but one, MA200. The back line on the chart.
MA200 works as support and denotes the broader and bigger cycle. As long as the action happens above this indicator, the market is growing thus bullish long-term. If the action moves below, the bears are in and winning.
Another strong moving average is EMA89, blue on this chart.
When TOTAL2 was bearish it managed to close only briefly below this level. One week and the next week back green. August 2024 and September 2024 TOTAL2 found support at MA200 and EMA89. As soon as these indicators were confirmed as support, we saw the development of a new bullish wave.
The altcoins market grew in November leading to a peak in December 2024. Here the same pattern repeats. TOTAL2 went from bullish to bearish. While it was bullish, it traded above all of the moving averages: EMA8, EMA13, EMA21, EMA55, EMA89 & MA200. As it turned bearish, all these moving averages were tested as support, all of them broke but one, MA200.
In April 2025 MA200 was tested as support and holds. As long as TOTAL2 trades above this level, we know the bigger broader market bias remains bullish. Bullish confirmed. As soon as this level was tested we had a small recovery above all moving averages, until May. Then a retrace led to a test of EMA89 as support and this level holds.
When TOTAL2 trades above all the moving averages, bullish confirmed.
TOTAL2 is now trading above EMA8, EMA13, EMA21, EMA55, EMA89 and MA200 on the weekly timeframe. Ultra-bullish and ready to grow.
Just as the December 2024 high was a higher high compared to March 2024, the late 2025 high will be a higher high vs December 2024. We are in a rising trend and this is confirmed because MA200 always holds as support.
Now that this level has been confirmed, we can expect additional growth. Instead of a single month of bullish action as it happened in late 2024, we can expect a minimum of 3 months of continued growth. In total, we will have at least 6 months, and then some more.
Because it is unexpected, this bull market will change your life, forever. You will receive more benefits and more blessings that anything you can ever imagine. All your hard work will pay-off. You will be rewarded for your patience, persistence and continued support.
Namaste.
Heavy resistance around $115,000
Heavy resistance around $115,000

Is it just me thinking we are at the top now? I dont see how we can penetrate this trendline . Your thoughts?
BTC/USDT Multi - time frame analysis and {4HR }
BTC/USDT Multi - time frame analysis and {4HR }

BTC/USDT Multi-Timeframe SMC Analysis – July 8, 2025
1. Top-Down Analysis:
Daily Timeframe (Macro Market Structure & Narrative - Inferred from chart context):
The broader market structure indicates a prolonged consolidation phase, initiated around mid-June, characterized by defined support and resistance levels. The identified supply zone, ranging approximately from $108,000 to $109,500 and labeled as "Potential Supply Zone" on the chart, is a key daily-level area.
Crucially, despite entering this daily supply, the strong underlying bullish order flow suggests a high probability that this supply zone may not act as an effective distribution point. The overarching narrative from higher timeframes indicates robust institutional buying pressure, implying a potential shift in the broader trend to unequivocally bullish upon a clear breach of this daily supply.
4H Timeframe (Swing Structure, Internal BOS/CHoCH):
The 4H swing structure explicitly displays a very clear bullish order flow. We observe a series of consecutively confirmed CHoCH (Change of Character) and BOS (Break of Structure) to the upside (indicated by "4HR CHOCH" and "4HR BOS" annotations). This unequivocally establishes a decidedly bullish 4H swing bias.
The most recent 4H BOS occurred around the $107,000 level, after which price has continued its upward trajectory.
Price is currently engaging with a 4H supply zone (marked by the white box). However, given the dominant bullish order flow on the 4H, there is a high probability that this supply zone will be invalidated, allowing price to extend its bullish movement. This phenomenon often signifies an "Imbalance Fill" or "Liquidity Grab" by smart money to fuel further upside.
1H Timeframe (Entry-Level Structure & POIs):
The 1H timeframe currently reflects a phase of consolidation or minor correction following the recent bullish impulse.
In alignment with the decisive bullish 4H bias, any retracement observed on the 1H timeframe is to be considered a buying opportunity.
The "PIVOT" marked around $105,000 serves as a potential 1H demand area, which could be a target for a deeper retracement before the continuation of the bullish move. However, considering the current market strength, price might not even reach this level and could resume its ascent from current or slightly higher levels.
The current "PIVOT" at approximately $108,500 represents a temporary internal resistance. A decisive break and sustained close above this pivot would provide stronger confirmation for the continuation of the bullish trend.
2. Identification:
Clean Breaks of Structure (BOS) and Changes of Character (CHoCH):
4H: Multiple clear bullish BOS and CHoCH events, indicative of strong bullish order flow.
1H: Internal structure currently shows consolidation prior to a likely bullish BOS to new highs.
Valid Supply & Demand Zones (Unmitigated only):
Unmitigated 4H/1H Supply Zone: Approximately $108,000 - $109,500 (marked by the white box). However, as noted, it is anticipated to be invalidated due to the overall bullish order flow.
Unmitigated 4H/1H Demand Zones: Lower down, around the $105,000 PIVOT and the green-shaded regions on the chart (potential demand areas that would activate upon a deeper retracement).
Internal and external liquidity pools (buy/sell-side):
External Buy-side Liquidity: Above the all-time highs or previous "High" (observed at $111,900 on the prior chart).
Internal Buy-side Liquidity: Above current range highs (approx. $109,500) and above recent pivots.
Internal Sell-side Liquidity: Below recent 1H pivots, particularly below $107,000 and $105,000 (which could act as inducement).
Inducement patterns and liquidity grabs (internal sweeps):
Any minor retracement or downside fluctuation from the current supply zone could act as inducement to draw in sellers, before price resumes its bullish trajectory.
Previous sweeps to the downside have served as confirmation of liquidity accumulation for prior bullish moves.
Order blocks, FVGs, mitigation blocks, and imbalance zones:
Given the impulsive nature of the bullish moves, bullish FVGs and OBs should be considered in retracements (e.g., around the $105,000 demand area).
The current supply zone (white box) also contains OB/FVG, but as mentioned, its invalidation probability is high.
Active market range and internal liquidity engineering:
The active 4H market range encompasses the recent bullish move from $102,000 to current highs.
Internal liquidity engineering currently involves drawing sellers into the supply zone and subsequently invalidating it for continued bullish advancement.
3. Delivery:
Directional Bias with Contextual Narrative:
Strongly Bullish. The 4H order flow is unequivocally bullish, with repeated confirmations of bullish BOS and CHoCH. While price is entering a supply zone, the overall bullish strength suggests it is highly probable this zone will be invalidated, leading to further upside to target new highs. The market narrative points towards a continuation of the uptrend, targeting external buy-side liquidity.
Actionable Setup (Long):
Asset: BTC/USDT Perpetual Futures
Entry Level (POI, OB or FVG):
Scenario 1 (Aggressive Entry - given market strength): Enter long within the $107,500 - $108,000 range (upon confirmation of bullish price action on the 1H or 15-minute timeframe within the supply zone, indicating its invalidation). This entry presumes the supply zone will be breached.
Scenario 2 (Conservative Entry - upon retracement): Enter long within the $105,000 - $105,200 range (the pivot area and potential demand zone). This point would activate upon a deeper retracement into a discount area.
Given the chart and current strength, Scenario 1 appears more probable, but price action confirmation is critical.
Stop-Loss (Invalidation Structure):
For Scenario 1: Place stop-loss below the last valid 1H structural low that confirms the bullish impulse, or below $106,500.
For Scenario 2: Place stop-loss below the demand zone and below the $104,500 pivot, e.g., $104,000.
Target Level (Minimum 3R+):
Target 1 (1R): $109,500 (Break of current supply range high and liquidity grab).
Target 2 (2R): $111,000 (Retest of previous "High").
Target 3 (3R+ / Primary Target): $112,500 - $113,500 (Formation of new highs and targeting fresh buy-side liquidity).
R-multiple Calculation Example: If for Scenario 1, entry is $107,700 and stop is $106,500 (1200 points risk), a 3R target would be $107,700 + (3 * $1200) = $111,300, which aligns with our targets.
Confluences:
Multi-Timeframe Alignment: Decisive bullish 4H order flow provides strong support for a bullish bias, treating any retracement as an opportunity.
Liquidity: New highs and external buy-side liquidity serve as clear targets.
Supply Zone Weakness: Despite price entering a supply zone, the underlying bullish strength suggests its probable invalidation.
Pivot Price Action: Repeated bullish pivots and structural breaks confirm the trend.
This analysis presents a high-conviction long setup for BTC/USDT. However, close attention to price action confirmations on lower timeframes (e.g., 1H or 15-minute) within the current supply zone will be crucial for aggressive entry. Should price retrace, anticipate a bounce from lower demand zones.
Disclaimer: This is a market analysis based on current price action and structure. It does not constitute a buy or sell signal. Always conduct your own research and risk assessment before taking any trades
BTCUSDT.P
BTC Trading Idee (mehr Analysen)
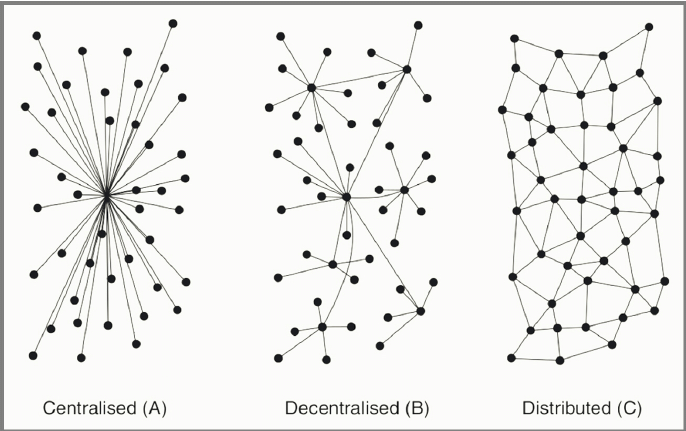
Im Laufe der Jahre werden viele Unternehmenslandschaften durch die Blockchain Technologie nachhaltig verändert und ersetzt werden. Bestehende zentrale Prozesse werden durch neue Innovative Anwendungen dezentral und autonom vereinfacht.

Durch das dezentralisierte, unveränderbare Datenregister benötigt die Blockchain keine Drittparteien und hat den Vorteil der Vertrauensbildung durch Proof of Work oder Proof Stake Consens.
ETH Trading Idee (mehr Analysen)
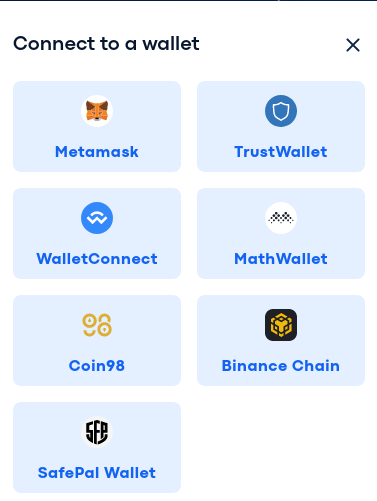
Block Chain Wallet (mehr Tauschen)
Dezentrale Exchange Wallet zur Aufbewahrung von Block Chain Coins und Token. xchange, farms, liquitity Pool platform auf Ethereum, Binance, Avalanche, Matic und anderen Smart Chains in Verbindung durch custodial oder non-custodial Wallets.
Coin Heatmap
Coin Converter
Coin Überblick
Google Such Volumen
Google Search Volumes
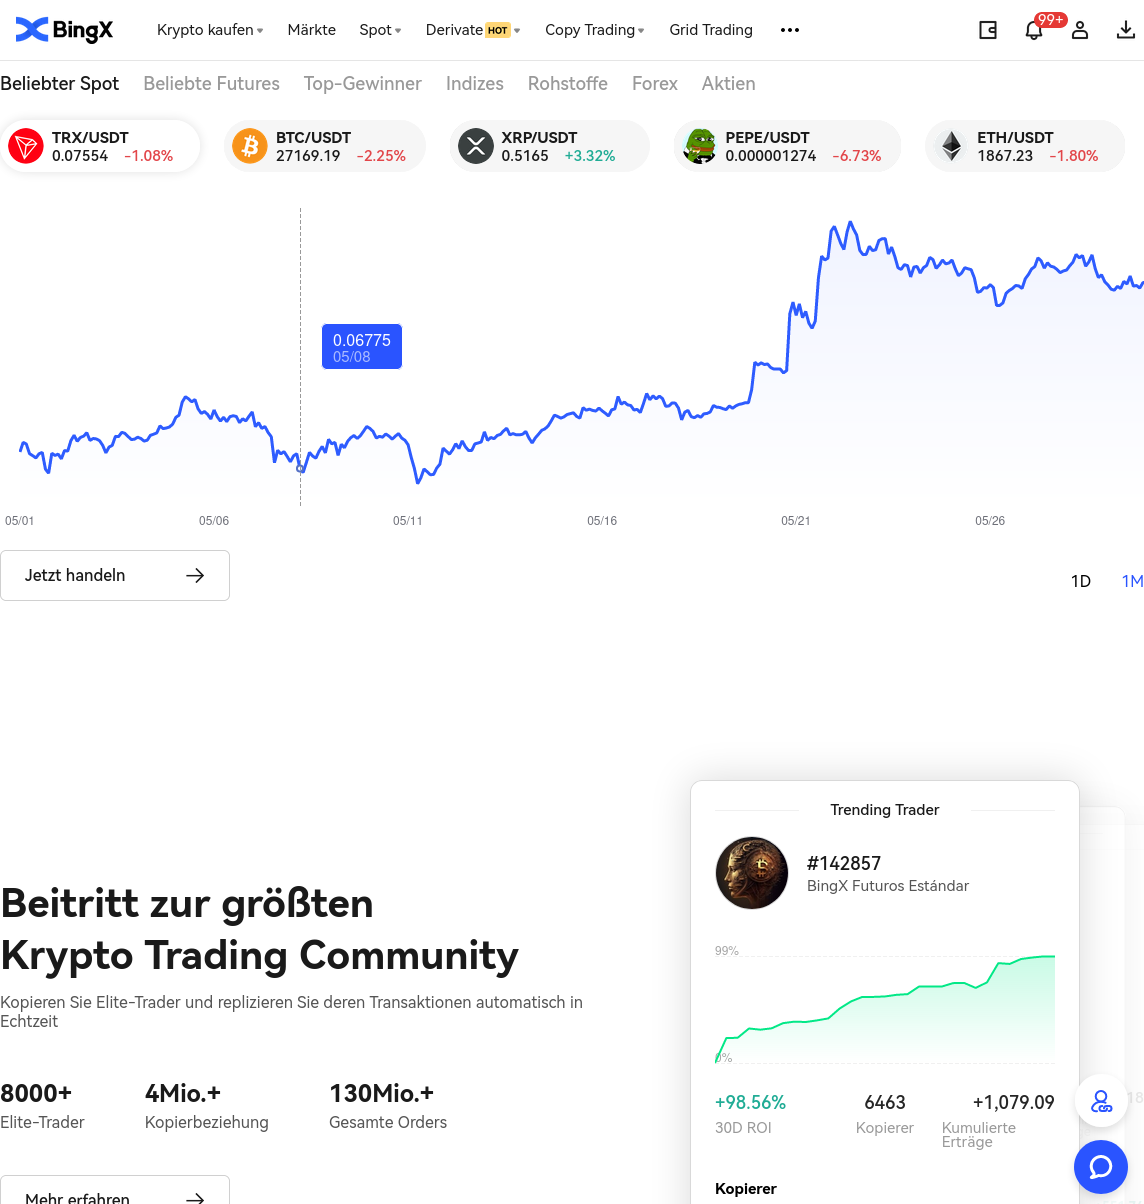
Crypto Trading
Interessiert? Schau einfach mal unter BingX nach.
schnelle ein und auszahlung großer COINs. hohe LIQUIidität, viele Paare, usw.
Average Transaktion Fee
Daily transaction fees divided by the number of transactions made on the Bitcoin and Ethereum blockchains. Chart uses 7-day moving average.
Active Adresses
The number of unique addresses that were active in the network either as a sender or receiver. Only addresses that were active in successful transactions are counted. Chart uses 7-day moving average.
TA Bitcoin
TA Ethereum
TA Litecoin
Anwendungsgebiete der Blockchain Technologie
BlockchainTechnologie ob Proof of Work, Proof of Stake oder andere Hybride Varianten findet in vielen Bereichen Anwendung und revolutioniert die Art und Weise, wie Daten gespeichert, verwaltet und ausgetauscht werden. Einige der wichtigsten Anwendungsbereiche sind:
1. Lieferkettenmanagement
- Transparenz und Rückverfolgbarkeit: Blockchain verbessert die Transparenz in der Lieferkette, indem sie es Unternehmen ermöglicht, Materialien bis zu ihrer Quelle zurückzuverfolgen.
- Echtheitsnachweis: Durch QR-Codes, die Informationen über Produkte enthalten, können Unternehmen sicherstellen, dass ihre Waren authentisch sind und ethisch produziert wurden.
- Smart Contracts: Diese automatisierten Verträge ermöglichen eine effiziente Abwicklung von Zahlungen und reduzieren den Bedarf an manuellen Prozessen. Sie werden beispielsweise zur Automatisierung von Versicherungsansprüchen und Kreditverträgen eingesetzt.
- Tokenisierung: Vermögenswerte können digitalisiert und in Form von Tokens auf der Blockchain dargestellt werden, was neue Geschäftsmodelle ermöglicht.
- Patientendatenmanagement: Blockchain kann verwendet werden, um Patientendaten sicher zu speichern und zu verwalten, wodurch die Authentizität der Daten überprüft werden kann. Dies hilft, Betrugsfälle zu reduzieren und die Effizienz im Gesundheitswesen zu steigern.
- Dezentrale Energiehandelssysteme: Blockchain ermöglicht es Verbrauchern, überschüssige Energie direkt an andere Nutzer zu verkaufen, wodurch ein dezentraler Markt für erneuerbare Energien entsteht.
- Non-Fungible Tokens (NFTs): Diese digitalen Token ermöglichen es Spielern, In-Game-Gegenstände zu besitzen und zu handeln, was neue Einnahmemöglichkeiten schafft und das Spielerlebnis revolutioniert.
- Wahlen und Abstimmungen: Blockchain kann zur Sicherstellung der Integrität von Wahlen eingesetzt werden, indem sie eine transparente und unveränderliche Aufzeichnung aller Stimmen bietet.

Spielebereich Musikrechte Werbeindustrie
Finanzwesen Smart Contracts (intelligente Verträge) DAO (dezentrale autonome Organisationen) DeFi - NFT - P2P / Sozial / Netzwerke Tourismusbranche
Die Vielseitigkeit der Blockchain-Technologie zeigt sich in ihrer Anwendung über verschiedene Branchen hinweg, wobei sie nicht nur Effizienzsteigerungen ermöglicht, sondern auch Vertrauen und Transparenz fördert.
Finanzierung & Spenden
Eine Spende motiviert nicht nur, sondern ermöglicht es auch weniger Werbelinks & Anzeigen zu schalten.
Bitcoin (BTC)
1H7wuuJ7jXE35qj5UQYbrKioD6n2AJU54R
Litecoin (LTC)
LPgVFnSG8ip3oZG55eDztbmdvQJuvnY5bq
Ethereum (ETH + TOKEN*)
0xa95C259282B03dA3f6307d6C61Af997F7df1591D
* Es können alle ERC20 Token auf Ethereum Basis an diese Adresse gesendet werden. Vielen Dank für deine hilfreiche Unterstützung.
Blockchain Volume
Adjusted On-Chain Volume (7DMA)
Hallo Besucher, auf dieser Webseite findest du interessante Fakts über die Welt der Coins und Token aus dem Cryptocurrency Bereich. Charts, Analysen und Preise werden bereitgestellt unter anderem von Tradingview*. Die Webseite wird nur durch Spenden oder durch Anmeldung eines *Partnerlinks oder Banners finanziert. Dieser Dienst ist vollständig kostenfrei und es werden keine monatlichen Gebühren in Form von Abos oder Einmalzahlungen erhoben. Vergewissere dich ebenfalls das du nur die originale https://coin.click webseite mit SSL Verschlüsselung besuchst. Schau gern in die Crypto Gruppe herein und beteilige dich an Disskusionen rund um das Thema digitale Assets.


